Sentiment analysis is a powerful tool to help organizations understand how customers feel about their products and services. When organizations act on customer sentiment, they build brand loyalty, decrease user churn and enhance revenue streams.
And by digging deeper into sentiment, companies can pinpoint a host of consumer metrics, including aspects of the customer experience users enjoy the most as well as the main sources of frustration and friction. That’s why today we’re announcing that our Voice-of-the-Customer platform is expanding our sentiment analysis capabilities!
Next-level sentiment analysis
unitQ customers are now empowered to understand customer sentiment even more, at a granular level.
Sentiment analysis has always been available in the unitQ platform, with the unitQ AI discerning whether a user’s feedback is positive, neutral or negative — that is, whether feedback indicates that a user likes your product, doesn’t have a strong opinion of it, or dislikes it. Visualizations like charts and trend graphs can also be broken down by sentiment in unitQ.
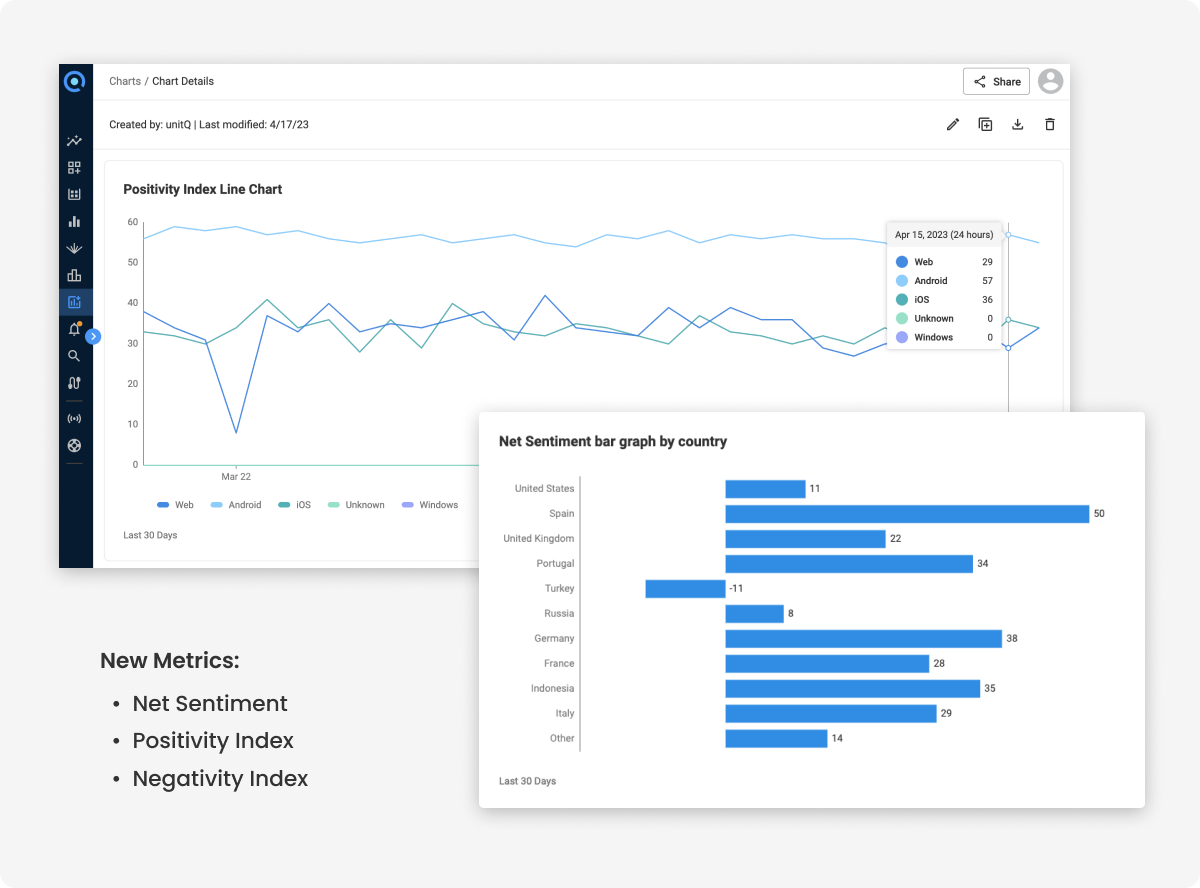
Now we’ve added additional metrics for unitQ customers so they can create more refined sentiment-oriented charts and dashboards in unitQ. This update enables organizations to better understand how customers feel about issues they might be having with a company’s products and services across all touchpoints:
-
Positivity index: The percentage of all feedback that has a positive sentiment. This can be a number from 0 to 100. A positivity index of 24 means 24% of your feedback is positive.
-
Negativity index: The percentage of all feedback that has a negative sentiment. This can be a number from 0 to 100. A negativity index of 10 means 10% of your feedback is negative.
-
Net sentiment: The difference between the positivity index and the negativity index. This value can range from -100 (the worst) to 100 (the best). So if your positivity index is 24 and your negativity index is 10, then your net sentiment is 14, which means in general that your users have an overall positive view of your product.
A deeper dive into user sentiment
By delving deeper into user sentiment, you can quantify how users feel about different aspects of your organization’s products and services. Organizations can visualize and understand sentiment around issue severity, launch performance, and brand engagement — or sentiment about any issue users may or may not be encountering.
For example, a key metric — net sentiment — is very compelling. It helps organizations ascertain the severity of a particular issue. Just because a user encounters an issue in your product, it doesn’t mean he or she holds a negative view of it.
On the other hand, if you gauge net sentiment after a product launch, and if the result is positive, it means your users like the new feature overall. Finally, you can use these metrics to pinpoint and improve elements of the user experience driving negative sentiment.
Allocate scarce development resources with knowledge
Understanding sentiment at a granular level is crucial when it comes to allocating scarce development resources. When organizations graph sentiment in unitQ’s charts and dashboards, they get real-time signals about how users feel about any path of their customer journey.
This empowers teams with the knowledge to know where they should immediately focus their efforts and where to plot short- and long-term roadmaps.
Augment unitQ Score
Users share valuable feedback about organizations every day on social media, help desk tickets, review sites, surveys, and more. unitQ centralizes feedback from all sources and automatically groups it into thousands of granular categories to help organizations discover what matters most to users — all in real time. These insights are also what unitQ parses through our AI to drive our sentiment analysis feature.
These real-time insights, however, also power another unitQ feature — the unitQ Score — which compliments our sentiment analysis capabilities.
The unitQ Score represents the gap between what customers expect and their actual experience with your product or service, and is expressed as a percentage of users reporting a frictionless experience.
Our sentiment metrics augment the unitQ Score to provide a holistic view of both emotion and product quality. In a single unitQ dashboard, organizations can understand how well your product is working and how your users feel about your product.

Above: With these new sentiment metrics, organizations can easily visualize how users feel, and can drill down into granular detail. For example, in the Net Sentiment bar graph by country, you can see that users in Spain are the most positive about a product. Users from Turkey are the least positive. The Positivity Index Line Chart shows the percentage of users of each platform with a positive view of a product over time.
Conclusion
By exploring user sentiment in depth, organizations can measure the emotions users express about products and services. To create better brand loyalty, these actionable insights highlight the severity of user pain points, the effectiveness of product launches and promotions, and more!
About unitQ
Category-leading companies like Bumble, Chime, HelloFresh, Pinterest, PrizePicks, Spotify and others rely on unitQ to drive growth, reduce churn, and build brand loyalty. Want to know what users think about your organization? Get a free analysis of your unitQ Score. To learn more about unitQ, request a demo.
Follow unitQ on Linkedin and Twitter.
Pete Bratach is Documentation Manager for unitQ


